The Future of Live Events and Sports
Update #33 — December 22, 2021
In our 33rd update to the “Future of Live Events & Sports: The Re-Emergence of Fans Post Covid-19”, we track how our framework for understanding Fan Demand is impacted by market-specific factors, venue initiatives, and fan avidity. We have sifted through all the noisy data to bring you insights on how live events and sports will be different because of the COVID-19 pandemic.
In this update, we explore:
- The impact of rising COVID-19 cases and market-based vaccine mandates on KAGR Fan Demand Index
- A new multi-part analysis series to examine factors beyond COVID-19 that are impacting attendance
- The impact of rising fan costs on the 2021 MLB season

Market Analysis
The KAGR Fan Demand Index remained flat report-over-report. Denver (+6%) followed by Minneapolis, Las Vegas, and St. Louis (all +4%) experienced the greatest increase while Cleveland (-3%), Dallas (-2%), Boston (-2%), and Washington D.C. (-2%) had the greatest setback.
On average, confirmed COVID-19 cases increased 45%, driven by Dallas (+1000%), Austin (+383%), and Houston (+375%). 3 markets saw decreases led by Denver (-20%), Salt Lake City (-8%), and Minneapolis (-4%). Vaccination rates continues to increase, with the eligible market population (with at least one shot) up 1.7%; the lowest increase since late September.
Consumer and economic indicators fluctuated across markets. Consumer behaviors decreased by more than 10% with San Francisco (-44%), Washington D.C. (-39%), and New York City (-35%) experiencing the largest setback. However, dining and entertainment increased by 4% on average with St. Louis (+59%) and Pittsburgh (+18%) seeing the biggest jump. We anticipate changes in the coming weeks given the rapid spread of Omicron and government led changes, including vaccine mandates in Philadelphia and Boston for indoor public places.
We continue to examine the impact of the pandemic on go-forward fan demand and behaviors. We delineate markets with the Most Impact, as measured by the percent change from pre-pandemic levels, from those with the Least Impact.
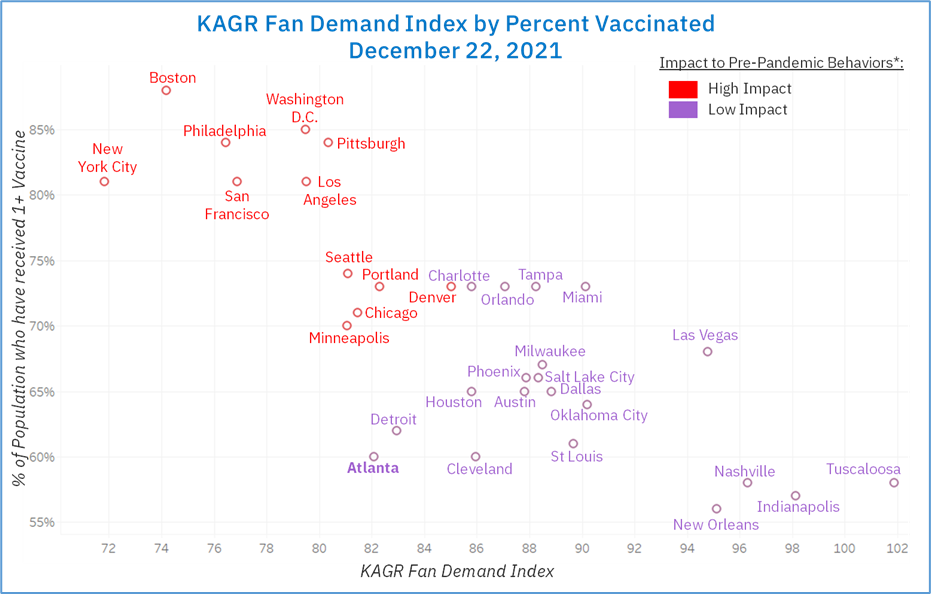
* KAGR Fan Demand index uses a variety of market data including COVID-19 factors, economic indicators, and other consumer behavior information. Impact to Pre-Pandemic Behaviors is defined as percent change of market indicators from pre-pandemic levels.

Fan Avidity at a Glance
As KAGR seeks to better understand what drives fan demand and ultimately attendance, we look beyond COVID-19. In our multi-part analysis series, we will examine the importance of factors including cost of attendance, strength of schedule, stadium experience, and other unique fan offerings. We believe the significance and impact of these factors have shifted because of the pandemic. Sports leagues, teams, and industry players will need to recalibrate their strategies to optimize in-venue demand.
COST OF FAN ATTENDANCE – MLB SPOTLIGHT
We start with MLB. KAGR collected several pieces of data across the 2019 and 2021[1] seasons for all MLB clubs including attendance, available capacity, and Fan Cost Index[2] (FCI). To explore the impact of cost, we look at a league, region, and club level view.
League Level:
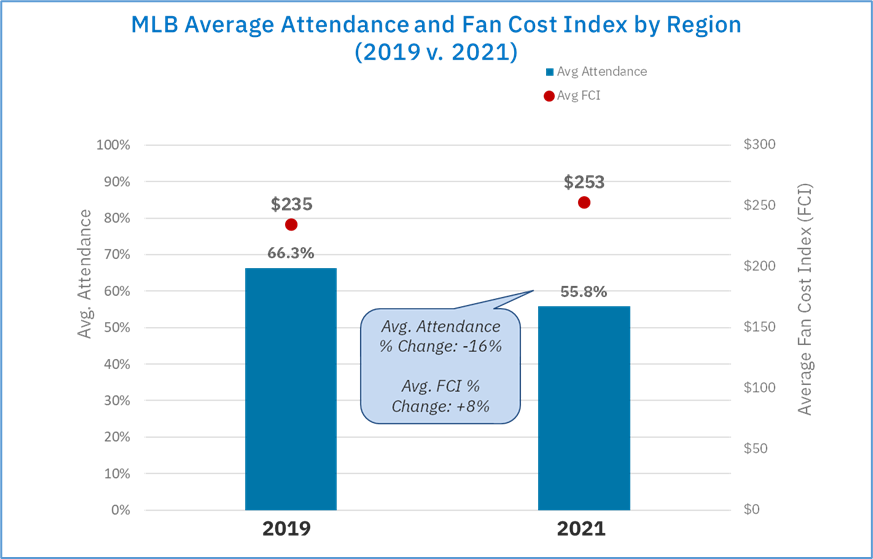
At a league level, attendance dropped -16% since 2019, nearly double the decrease from the 2016 to 2019 seasons (-7%), with the average cost of attendance across the league increasing by 8%.
Region Level:
* Regional breakdowns include:
- Midwest (MW): Chicago Cubs, Chicago White Sox, Cleveland Indians, Colorado Rockies, Cincinnati Reds, Detroit Tigers, Kansas City Royals, Milwaukee Brewers, Minnesota Twins, St. Louis Cardinals
- Northeast (NE): Boston Red Sox, New York Mets, New York Yankees, Philadelphia Phillies, Pittsburgh Pirates, Washington Nationals
- Southeast (SE): Atlanta Braves, Miami Marlins, Tampa Bay Rays
- Southwest (SW): Houston Astros, Texas Rangers, Arizona Diamondbacks
- West (W): Los Angeles Angels, Los Angeles Dodgers, Oakland Athletics, San Diego Padres, San Francisco Giants, Seattle Mariners
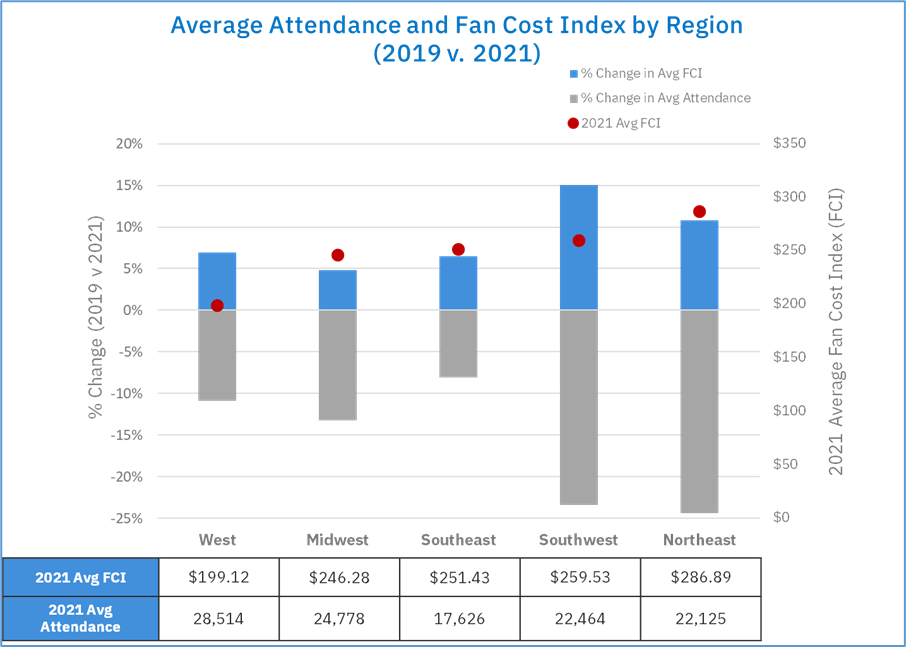
At a regional level, we see greater variation in how the cost of attendance may be impacting attendance with concerning trends in the Northeast and Southwest. Insights include:
- The Northeast and Southwest regions increased their average FCI by 11% and 15%, while experiencing the largest drop in attendance (-24% in the Northeast and -23% in the Southwest).
- Many of these markets have been amongst the lowest KAGR Fan Demand Index which certainly plays a factor; however, we believe coupled with the impact of cost, there is a double whammy.
- 3 of the last 5 World Series Champions (HOU ’17, BOS ’18, WAS ’19) hail from the Northeast and Southwest regions; despite strong on field performance, demand has still dropped.
- The remaining three regions (Midwest, West & Southeast) increased on average by 6%, with attendance decreasing by 9%.
Specific MLB Club Analysis:
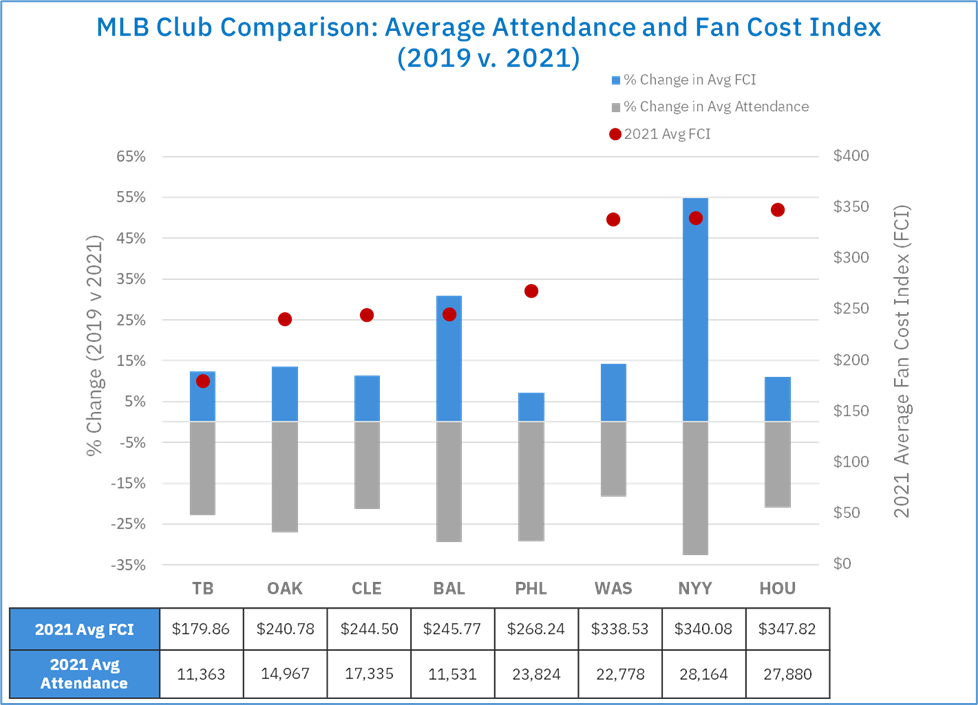
To take our analysis further, we selected eight clubs (NYY, BAL, OAK, CLE, WAS, HOU, TB, PHL). This grouping represents a mix of regions, club performance, and historic fan avidity. Specific insights include
- On average these teams increased their cost of attendance by 15% while attendance decreased by 25% on average.
- The 3 highest increases to the cost of attendance were:
- Baltimore Orioles (+31% to $245.77)
- New York Yankees (+16% to $340.08)
- Washington Nationals ($296.48 to $338.53)
- The 3 largest decreases to attendance were:
- New York Yankees (-33%)
- Baltimore Orioles (-29%)
- Philadelphia Phillies (-29%)
- The club experiencing the greatest impact of increased cost was the Philadelphia Phillies, seeing a 29% decrease in attendance and a 7% increase in cost.
Outlier Clubs:
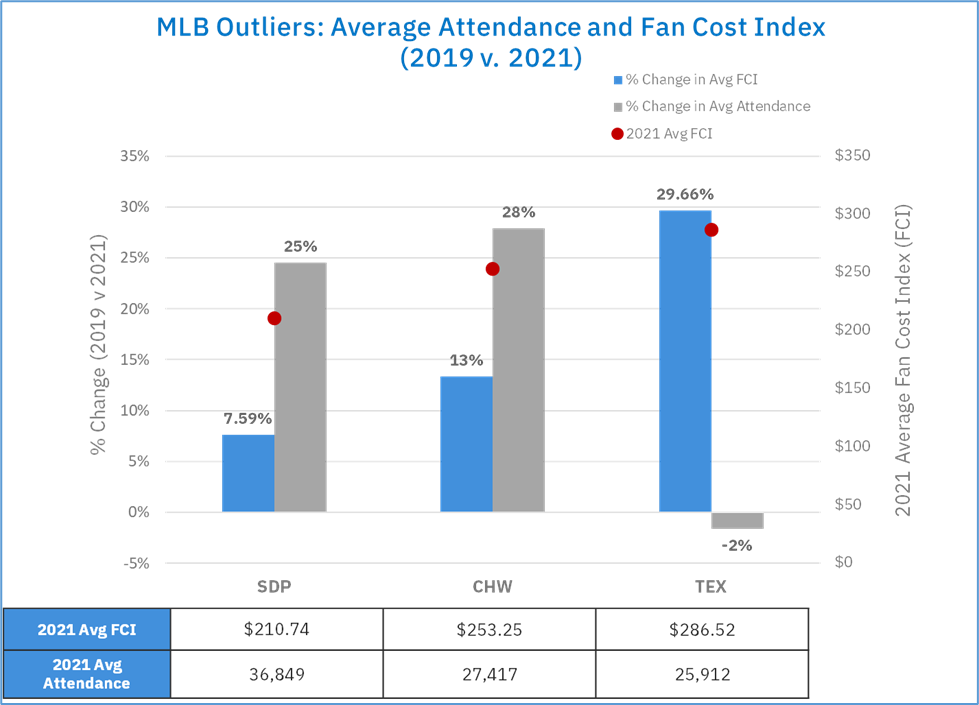
While we believe cost of attendance is a major factor in driving and sustaining attendance, we did identify a few exceptions. These teams had unique circumstances in the 2021 season including a new stadium (Texas Rangers), star player acquisitions (San Diego Padres), and strong relative team performance (Chicago White Sox).
- The Texas Rangers built a $1.2B new stadium in 2020; even with the cost of attendance increasing by 30% they saw minimal impact to attendance year-over-year. In general, this is to be expected for the first year of operations; a similar trends was seen by the Atlanta Falcons in the NFL.
- The Chicago White Sox won their first Division title in 13 years in 2021; a 13% increase in cost of attendance had no impact to attendance.
- The San Diego Padres signed star player Fernando Tatis Jr. to a 14-year $340 million extension along with several other key players; they also saw no impact of their 8% cost of attendance increase.
CONCLUSION
From 2019 to 2021 we saw an average cost of attendance increase of $19 across the MLB. 22 teams increased their cost of attendance by an average of 10.4%. Only two clubs, the Chicago White Sox and San Diego Padres, saw an increase in attendance. While cost is only one factor, over the course of a regular MLB season it represents a key input into the fan’s willingness and ability to attend. Coupled with the state of the world with COVID, organizations access to data to monitor fan behaviors and adjust in real-time is more critical than ever.
We look forward to continuing this series, extending our cost of attendance analysis across all professional leagues, and exploring the impact of other factors on fan demand and attendance.
[1] 2021 attendance data was only used for games in which the MLB team was at full capacity
[2] Fan Cost Index is comprised of the prices of four average-price tickets, parking for one car and the least expensive ballpark-available pricing for: two draft beers, four soft drinks, four hot dogs and two (adult-size) adjustable caps. Costs are determined through calls, emails and online research with teams, venues, concessionaires, and season ticket holders. Identical questions are asked of all sources.